Essentials series · Zonearchitect indicator
Zonearchitect
Automatically maps the strongest supply and demand zones, then fades and removes them as price tests and breaks through.
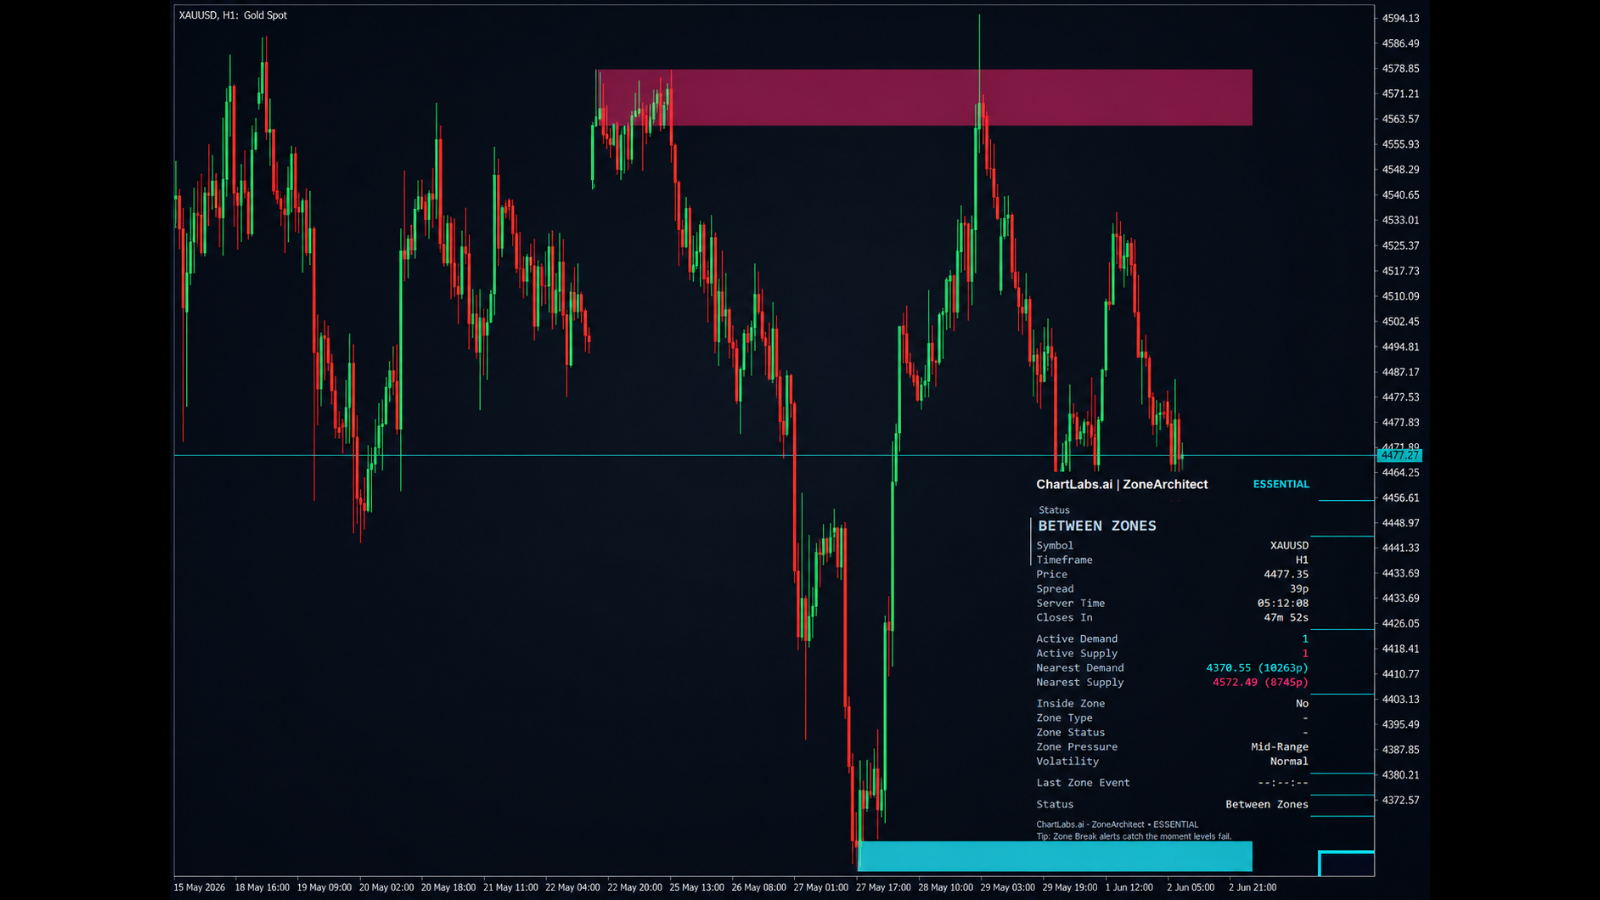
ZoneArchitect automatically maps the strongest supply and demand zones from clean origin candles, showing you precisely where price is likely to react. Zones progress through Fresh, Tested, and Retested states with visual colour fading, hold up to six active levels per side, and are removed automatically once broken or tested three times. Non-repainting touch and break alerts fire on closed candles, and a clean dashboard reports nearest-zone distance — giving you well-defined, structurally sound trade locations.
Included in: Essentials plan
Essentials
ChartLabs.ai
VER. 4.0.1Essentials
Core Indicator Suite
Quantum Field Engine
Collection Essentials Indicators
FocusTrend · Pullbacks · Volatility
STATUS // ACTIVE
Chart preview · Essentials indicators applied